TI-BASIC:SK:More Shapes
Now that you know how to adapt the screen to your needs, to store pictures and graph databases and to turn off and on points, you need to create more. The Ti-Basic has no shape like squares or triangles. The only shapes you can create are limited. You can draw lines or circles. But with line, you'll draw squares and all other things.
Lines
If you need to draw a square, you'll need to draw 4 line segments. But if you only want to separate the screen in half, you'll use a line. Here are the differences...
Horizontal
The Horizontal command is used to draw a line from left to right of the Graph Screen. Press 2nd, Draw then scroll until you find 3:Horizontal. You need to enter the Y coordinate of the line. Let's say you have a window with these settings: 0→Ymin and 10→Ymax. The Xmin and Xmax settings don't matter.
:Horizontal 5
This will draw a line horizontally in the middle of the screen.
Vertical
You'll found Vertical in the Draw Menu, by pressing 4:Vertical. The Vertical command is used to draw a line from top to bottom of the Graph Screen. This time, you need to enter the X coordinate of the line. Let's say you have a window with these settings: 0→Xmin and 10→Xmax. This time it's the opposite. The Ymin and Ymax settings don't matter.
:Vertical 5
This will draw a vertical line in the middle of the screen.
Line(
If you don't want your line to go to the end of the screen but to stop at a coordinate, Line( is for you. Simply go in the Draw menu, and press 2:Line(. It draws a line from a coordinate to another. The syntax goes like this: Line(X1,Y1,X2,Y2). A fifth argument is optional. If you put 0 as the fifth argument: Line(X1,Y1,X2,Y2,0), it'll erase the line.
:Line(2,2,2,8)
:Line(2,8,8,8)
:Line(8,8,8,2)
:Line(8,2,2,2)
Circle
Circles are very simple to draw. You can access them by the Draw menu and by scrolling down to 9:Circle(. You simply enter your coordinate then your radius. Circle(X,Y,r) will draw a circle of center X,Y with a radius of r. A forth argument is optional and will draw your circle much faster. Simply add an imaginary list at the end of it to have: Circle(0,0,4,{i}).
You can test it if you want:
:ZStandard
:Circle(0,0,3)
:Circle(0,0,5,{i})
Using Functions
Here are commands that draw lines or curves accordingly to a function. You'll not use them frequently but here they are if you need to use them.
DrawF
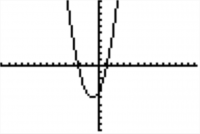
You can use the DrawF command if you need to draw a function. The DrawF command is useful because it is erased with the rest of the Graph Screen when you use the ClrDraw command, which is not the case of a function entered directly in the "Y=" window. The syntax goes like this:
:DrawF X²+2x-4
And it would draw something like this:

DrawInv
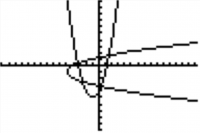
As the DrawF command, it draws a function. But this time, it draws the inverse of the function you enter. The syntax is the same and again, it'll get erased with the rest if you enter ClrDraw.
Here's what this code would do:
:DrawF X²+2x-4
:DrawInv X²+2x-4
 Note: You can also enter DrawF Y,,1,, or even DrawF Expr(Str1 and it will also work. (Same thing for all the DrawInv and the Tangent( commands.)
Tangent(
The Tangent( command draws a function and it tangent. I know you'll not use it frequently so this is really optional to know. Basically, the syntax goes like this:
:Tangent(X²+2x-4,A)
Where you obviously replace A with the tangential point.
Shade(
The function Shade( is quite useful. This darkens the window from an horizontal line from another if you use points in the syntax or from a function to another if you enter a function as an argument.
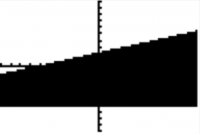
Let's have an example. For a window with -15:Xmin, 15:Xmax, -10:Ymin, 10:Ymax, Shade(-10,10) would turn the Graph Screen black. Here's another one:
:Shade(-6,X/3+2)
:Pause
:ClrDraw
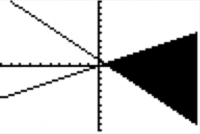
:Shade(-X+1,X/2)

 First of all, you maybe noticed I used a Pause command on the Graph Screen. Yes, it is possible and quite often to use it. It works the same as before, so you need to press Enter to continue the program. The second thing is that Shade( only darkens points that are between the 1st argument and the second. Not between the second and the first. You have a great example on the second picture.
Game: Dices
These are basically the shapes you can create but now you can combine those. So let's create a little game so you don't get confused before we continue. We'll create a game that will roll 5 dices and display them on the Graph Screen.
Here we go...
We first need to adjust the window for what we'll do. Xmin/Ymin can be found in Vars→Window→X/Y submenu.
:ClrDraw
:FnOff
:AxesOff
:0→Xmin
:0→Ymin
:94→Xmax
:62→Ymax
But the part with the dimensions could have been replaced to be quicker by:
:ZStandard
:104→Xmax
:72→Ymax
:ZInteger
By now, there's noting we've haven't seen. Here's the nice part ! We'll go step by step. First we'll draw the dices. For sure, we could have determined all the line individually and if you're not ready for smaller code it's ok but here's how we would do to mix all together and add loops! Try to understand this code before continuing and type it in your own calculator.
:For(I,4,76,18)
:Line(I,21,I,35)
:Line(I,21,I+14,21)
:Line(I,35,I+14,35)
:Line(I+14,21,I+14,35)
:End
Now that we have the dices, we need to roll them. Let's use a list to store the results... I let you choose your own code but it shouldn't be longer than a line. Here's how I would do: Collapsible_Show="+_Show"_Hide="__Hide"
:randInt(1,6,5)→L₁
/collapsible Simple eh ? After, we need to create a loop to let the user roll the dices as long as he wants and stop when he hit the Clear key. We'll use the Getkey and the While command. Now he's the "tricky part". I'll let you try to code your own output for the dots on the dices but you'll probably want to look this one. Collapsible_Show="+_Show"_Hide="__Hide"
:0→K
:While K ≠ 45
:getkey→K
:For(I,1,5)
:18I-7→X
:If fPart(L₁(I)/2)=.5
:Pt-On(X,28,2)
:If L₁(I)≠1:Then
:Pt-On(X-4,32,2)
:Pt-On(X+4,24,2)
:End
:If L₁(I)>3:Then
:Pt-On(X-4,24,2)
:Pt-On(X+4,32,2)
:End
:If L₁(I)=6:Then
:Pt-On(X-4,28,2)
:Pt-On(X+4,28,2)
:End
:End
:End
/collapsible Ohhh... so try to understand what I did before continuing. First, only the odd numbers have a dot in the center and so I did. With FPart(, I was able to know if the Ith number of my list was odd or even. Now, only one has not dots at the top left and at the bottom right of the dice. After that, you should be able to understand the rest of the code...
Oh, I forgot to explain the X variable. It simply stores the coordinate of the center of the dice in X. Notice that this is an algorithm. We use them frequently when programming because it simplifies greatly the code. I could have said like 10 times Pt-On(18I-7+4 or 18I-7-4 but there will be a lot of other situations where you'll need to create algorithm.
Let's finish with these lines to give our program (although it's not the greatest game you've played) to our friends without having to explain them how to get back their Graph Screen before their exam...
:ClrDraw
:AxesOn
:ZStandard
:Output(1,1,"
And he's the whole game:
:ClrDraw
:FnOff
:AxesOff
:0→Xmin
:0→Ymin
:94→Xmax
:62→Ymax
:For(I,4,76,18)
:Line(I,21,I,35)
:Line(I,21,I+14,21)
:Line(I,35,I+14,35)
:Line(I+14,21,I+14,35)
:End
:randInt(1,6,5)→L₁
:0→K
:While K ≠ 45
getkey→K
:For(I,1,5)
:18I-7→X
:If fPart(L₁(I)/2)=.5
:Pt-On(X,28,2)
:If L₁(I)≠1:Then
:Pt-On(X-4,32,2)
:Pt-On(X+4,24,2)
:End
:If L₁(I)>3:Then
:Pt-On(X-4,24,2)
:Pt-On(X+4,32,2)
:End
:If L₁(I)=6:Then
:Pt-On(X-4,28,2)
:Pt-On(X+4,28,2)
:End
:End
:End
:ClrDraw
:AxesOn
:ZStandard
:Output(1,1,"
| << Graph Format Settings | Table of Contents | Text and Text Sprites >> |
