TI-BASIC:Func
Command Summary
Enables function graphing mode.
Command Syntax
Func
Menu Location
While editing a program, press:
- MODE to access the mode menu.
- Use arrows to select Func.
TI-83/84/+/SE
1 byte
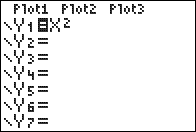
The Func command enables function graphing mode. This is usually unnecessary in a program, but if you want to graph a Y# equation, you'd want to make sure the calculator is in function mode first.
In function mode, you can graph equations where y (the vertical coordinate) is a function of x (the horizontal coordinate). This mode is most commonly discussed in algebra and single-variable calculus courses. Many curves, such as a parabola, have simple expressions when written in the form y=f(x).
However, in function mode, many expressions cannot be graphed at all. For example, a circle can't be easily graphed in function mode, since for some x-values, there are two y-values. Using two functions, you can achieve a circle, but it will still require a friendly graphing window to display perfectly.
Many calculator features are specifically targeted at function mode graphing. For example, two graphing styles (see GraphStyle() can be only used with function mode. The DrawF command draws a function in graphing mode.
Advanced Uses
The window variables that apply to function mode are:
- Xmin -- Determines the minimum X-value shown on the screen.
- Xmax -- Determines the maximum X-value shown on the screen.
- Xscl -- Determines the horizontal space between marks on the X-axis in AxesOn mode or dots in GridOn mode.
- Ymin -- Determines the minimum Y-value shown on the screen.
- Ymax -- Determines the maximum Y-value shown on the screen.
- Yscl -- Determines the vertical space between marks on the Y-axis in AxesOn mode or dots in GridOn mode.
- Xres -- Determines the pixel distance between points used for graphing. This is a value 1-8: 1 for best quality, 8 for best speed.
